All of the services that Azure offers for the instrumentation and observability (monitoring) of applications are grouped under Azure Monitor.
Three services fall under the banner of Azure Monitor:
- Azure Monitor itself, which offers the observability component to track your apps.
- Application Insights, or its substitute OpenTelemetry, which offers the instrumentation and telemetry components
- The analytics component is provided by Log Analytics.
We will emphasise the instrumentation component in this post.
Telemetry and instrumentation in Azure.
Telemetry, the data collected to observe your application, can be broken into three types or “pillars”:
- Distributed Tracing
- Metrics
- Logs
Azure provides two services that cover this area:
- Application Insights
- OpenTelemtry
Application Insights is the service we will discuss in this post because it offers thorough and rich capabilities for gathering information about your application. Yet OpenTelemetry deserves a quick mention.
OpenTelemetry on Azure:
Resuming with Application Insights
OpenTelemetry is the new kid in the hood and it is the future of telemetry. This initiative aims to standardize telemetry APIs and SDKs, and establish vendor-neutral SDKs for telemetry.
It is still in early phase of development, and it only cover the Distributed Tracing part of the telemetry.
The technology is widely utilised in the world of Docker and Kubernetes.
Recently, Azure Monitor began implementing OpenTelmetry by reading its data. Nonetheless, in general, we should choose Application Insights because it has far more functionality till this technology advances further, especially if we are working on App Service and Azure functionalities.
Now back to Application Insights.
Application Insights and Auto-Instrumentation:
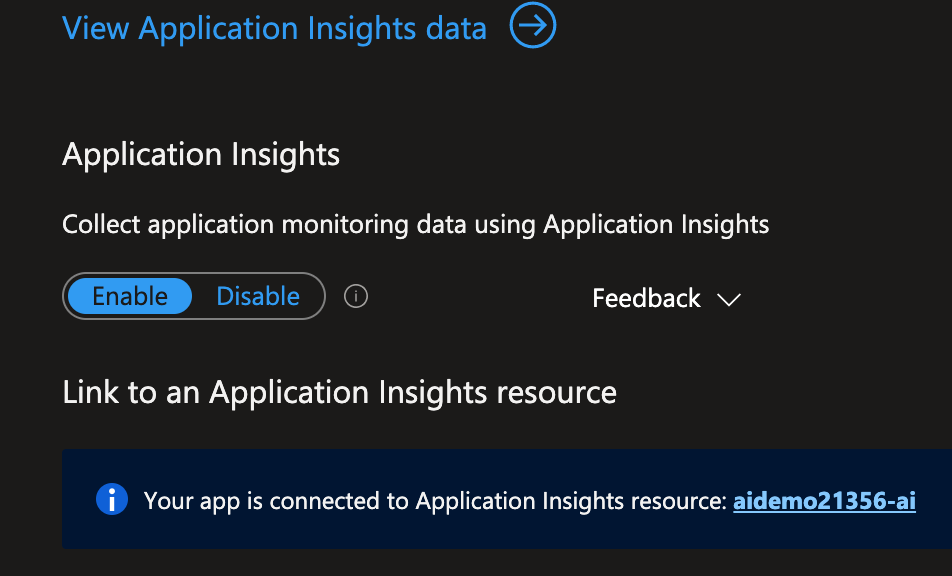
You can enable Application Insights on an App Service or Azure Function without writing any line of code. This feature is called Auto-instrumentation or “Run-time instrumentation” This feature is available because the App Service base image has a built-in agent that will collect the instrumentation and communicate with the Application Insights server.
Asp.net core (on both linux and windows) supports Auto-instrumentation.
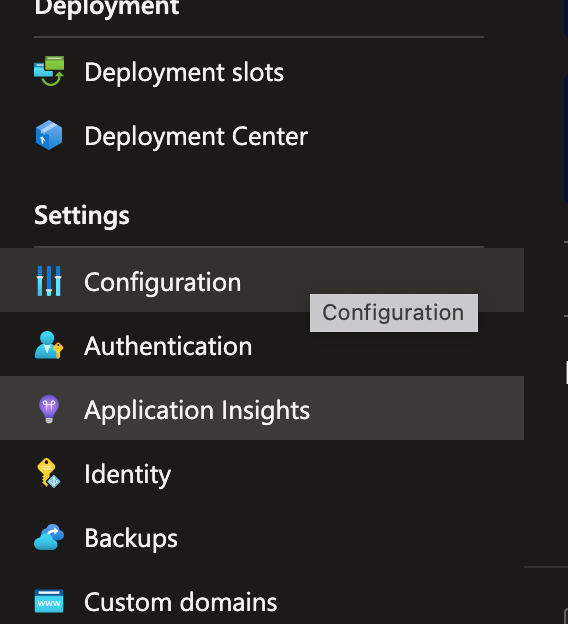
To enable Auto-instrumentation on an App Service, on Azure Portal check the App Service, and on the left side there is Application Insigths blade.


Auto-instrumentation on client side:
If you are using Asp.NET MVC application on Windows hosted App Service, or using Azure Static Web App, you can auto-instrument your JavaScript code, by just doing the following:
Add a new application setting APPINSIGHTS_JAVASCRIPT_ENABLED and set its value to true.
That will inject JavaScript SDK for Application Insights in your JavaScript code.
Client-side instrumentation captures information about the user experience of the app, including page load times, details of browser exceptions, and performance data about AJAX calls.
Application Insights and Manual-Instrumentation:
Although Auto-instremenation will provide good coverage, it is not enough. We need to track our application manually from inside the code. The more we track from inside the code the more coverage we will have on the performance and operational issues we encounter in production, which translates to better support.
Manual instrumentation on the Asp.NET server code:
To collect telemetry from the code, we need to include NuGet package:
1Microsoft.ApplicationInsights.AspNetCore
Then initialize the service from the code:
1var builder = WebApplication.CreateBuilder(args);
2
3// The following line enables Application Insights telemetry collection.
4builder.Services.AddApplicationInsightsTelemetry();
You can pass the connection string in the code, but better to provide it from the appsettings.json file as follows:
1// in appsettings.json
2"ApplicationInsights": {
3    "ConnectionString": "Copy connection string from Application Insights Resource Overview"
4  }
By just adding these few lines, our SDK will collect lots of metrics from the running application. It will collect:
- Application Dependencies: for example communication with databases including sql statements, or with blob storage.
- Performance Counters: for example memory and CPU usage.
- Events Counter: There are built-in events that the SDK will collect, and you can create your own custom event. For a list of built-in events check this link.
What to capture with the SDK
Many metrics can be collected, and each one has a corresponding config name which we can turned off
- Http request calls
- Performance counters (memory, CPU usage)
- Dependencies: check this for a list of trackable dependencies
- Heart Beat feature
- Events: this deserve another post
Frequency of metric sampling
How often the SDK will send sampling to Azure service?
We can configure that using sampling configuration. There are two options to define sampling frequency:
- Adaptive: which is the default
- Fixed-rate: which you can use to reduce the traffic to the server.
Logging to Application Insights
Finally, we need to do our logging in Application Insights.
First add this package:
1Microsoft.Extensions.Logging.ApplicationInsights
then we add this to our appsettings.json.
 1"ApplicationInsights": {
 2    "InstrumentationKey": "[The instrumentation key]"
 3  },
 4"Logging": {
 5    "PathFormat": "[The path and file format used in file logging, e.g.: c:\\log-{Date}.txt]",
 6    "LogLevel": {
 7      "Default": "Information"
 8    },
 9    "ApplicationInsightsLoggerProvider": {
10      "LogLevel": {
11        "Default": "Warning"
12      }
13    }
14  }
and add this when you configure the service collection
1// as we discussed before
2services.AddApplicationInsightsTelemetry();
3
4    services.AddLogging(logBuilder =>
5             {
6                 logBuilder.AddApplicationInsights(YourInstrumentationKey)
7                     // adding custom filter for specific use case.
8                     .AddFilter("Orleans", (level) => level == LogLevel.Error);
9    });